[python]代码库
import plotly.express as px

df = px.data.gapminder()
fig = px.scatter(df, x="gdpPercap", y="lifeExp", animation_frame="year", animation_group="country", size="pop",
                 color="continent", hover_name="country", log_x=True, size_max=55, range_x=[100, 100000],
                 range_y=[25, 90], height=600, width=1000)

# lineas and markers on first display
fig.for_each_trace(lambda t: t.update(mode='lines+markers'))

# lineas and markers on animation frames
for fr in fig.frames:
    for d in fr.data:
        d.update(mode='markers+lines')

fig.show()
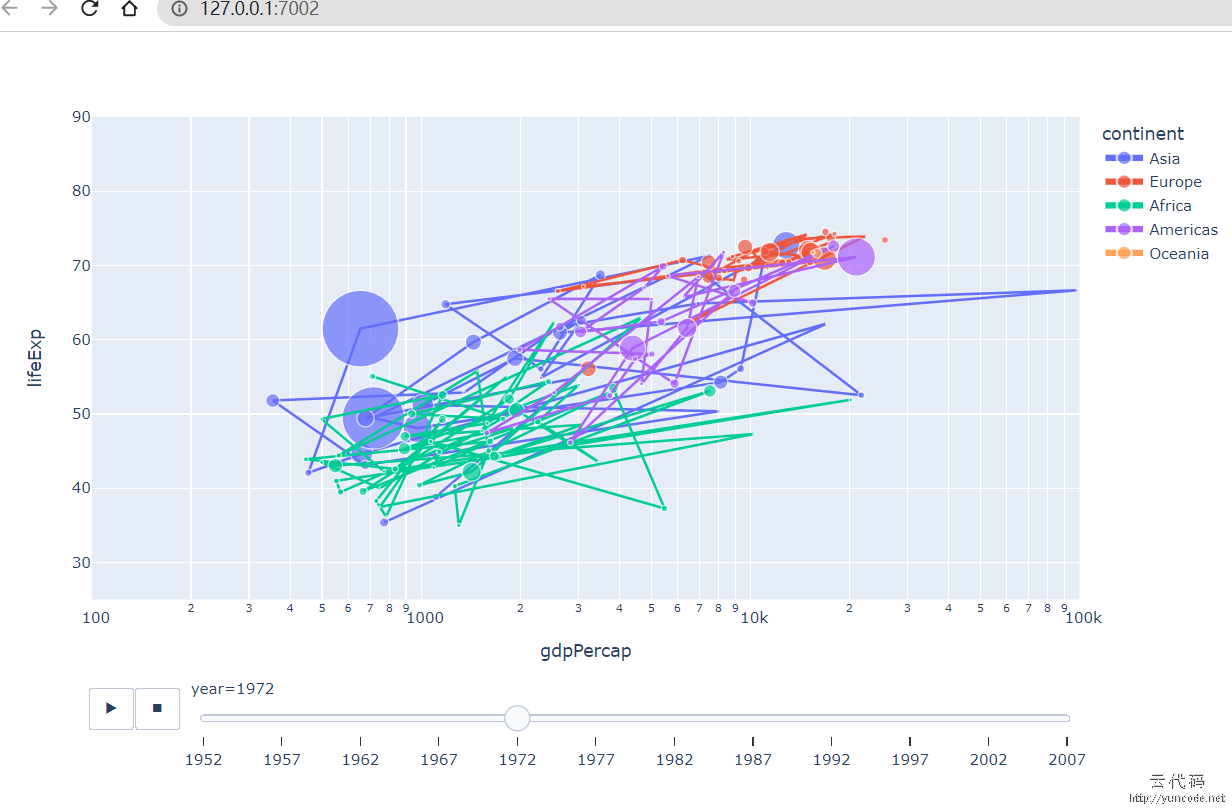
[代码运行效果截图]


高级设计师
by: Python自学 发表于:2022-11-18 03:33:32 顶(1) | 踩(1) 回复
python运行后会打开一个网页,点击play会播放动画
回复评论