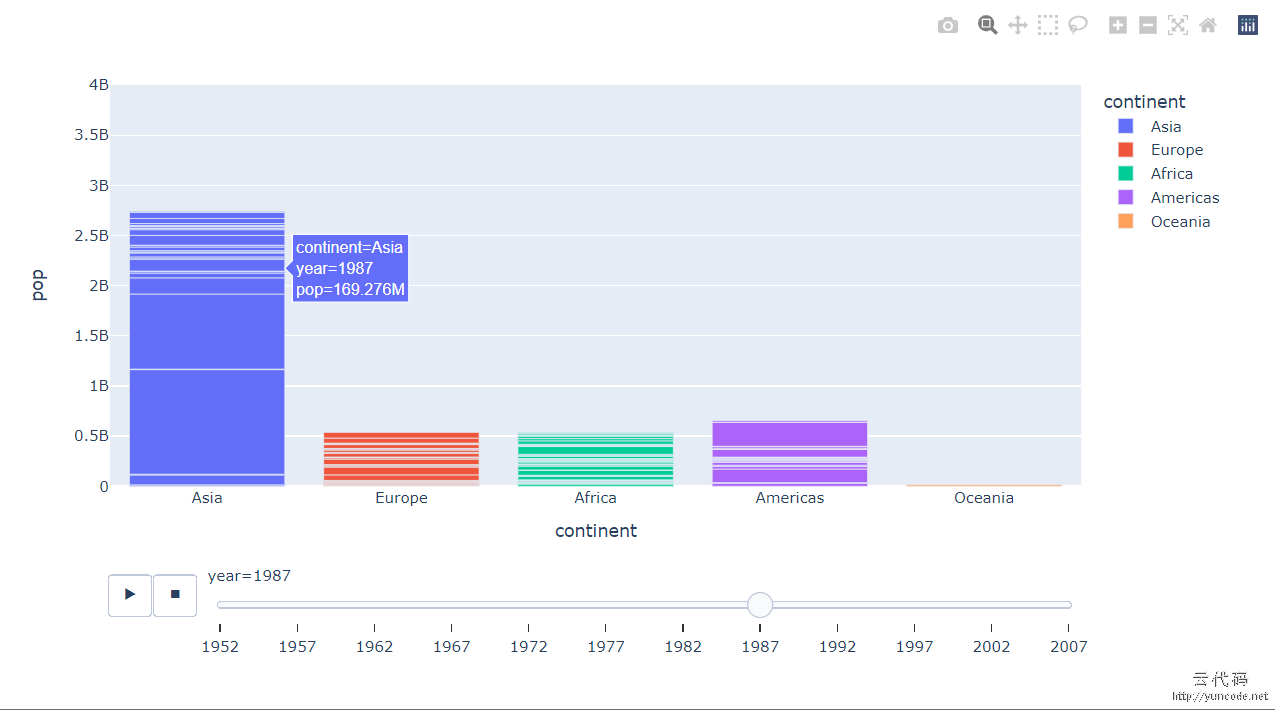
import plotly.express as px

df = px.data.gapminder()
fig = px.bar(df, x="continent", y="pop", color="continent", animation_frame="year", animation_group="country",
             range_y=[0, 4000000000])
fig.show()
高级设计师
by: Python自学 发表于:2022-11-18 03:33:29 顶(2) | 踩(1) 回复
python运行后会打开一个网页,点击play会播放动画
by: Python自学 发表于:2022-11-18 03:33:46 顶(2) | 踩(1) 回复
数据可自行修改


高级设计师
by: Python自学 发表于:2022-11-18 03:33:29 顶(2) | 踩(1) 回复
python运行后会打开一个网页,点击play会播放动画
回复评论