import matplotlib as mpl
import numpy as np
import matplotlib.pyplot as plt
np.random.seed(2000)
y = np.random.standard_normal((20, 2))
# print(y)
'''
不同的求和
print(y.cumsum())
print(y.sum(axis=0))
print(y.cumsum(axis=0))
'''
# 绘图
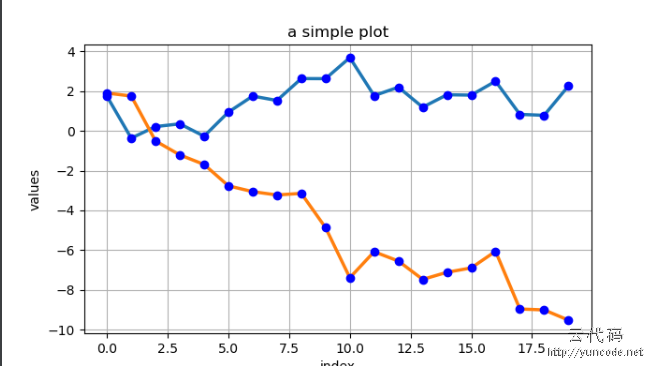
plt.figure(figsize=(7, 4))
plt.plot(y.cumsum(axis=0), linewidth=2.5)
plt.plot(y.cumsum(axis=0), 'bo')
plt.grid(True)
plt.axis("tight")
plt.xlabel('index')
plt.ylabel('values')
plt.title('a simple plot')
plt.show()