[python]代码库
import matplotlib as mpl
import numpy as np
import matplotlib.pyplot as plt
np.random.seed(2000)
date = np.random.standard_normal((20, 2))
y = date.cumsum(axis=0)
y[:, 0] = y[:, 0] * 100
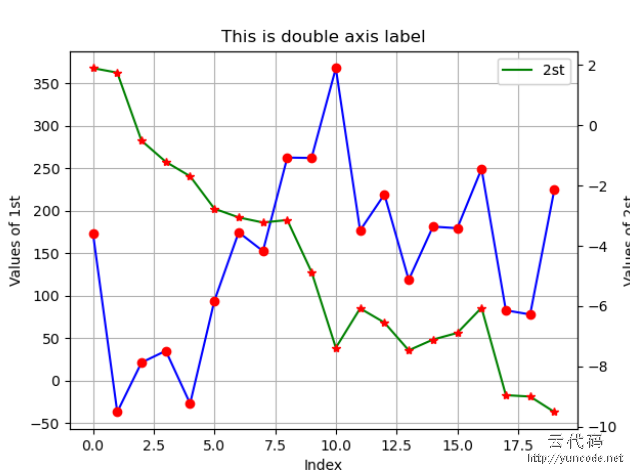
fig, ax1 = plt.subplots()
plt.plot(y[:, 0], 'b', label="1st")
plt.plot(y[:, 0], 'ro')
plt.grid(True)
plt.axis('tight')
plt.xlabel("Index")
plt.ylabel('Values of 1st')
plt.title("This is double axis label")
plt.legend(loc=0)
ax2 = ax1.twinx()
plt.plot(y[:, 1], 'g', label="2st")
plt.plot(y[:, 1], 'r*')
plt.ylabel("Values of 2st")
plt.legend(loc=0)
plt.show()
[代码运行效果截图]