import matplotlib.pyplot as plt
import numpy as np
# Create data for the plot
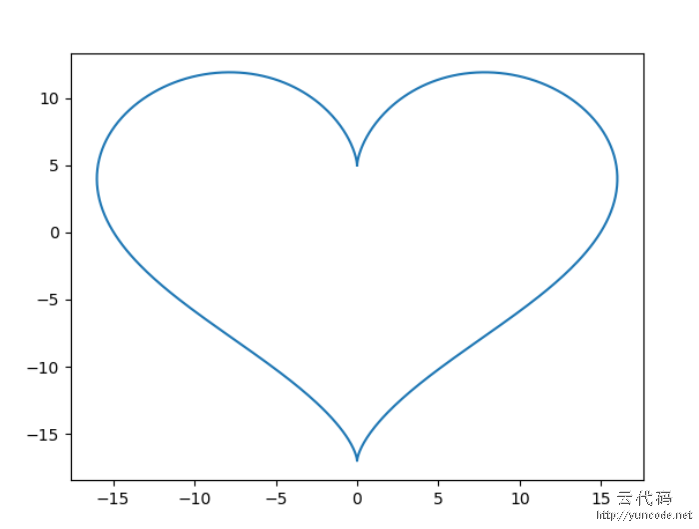
t = np.linspace(0, 2*np.pi, 100)
x = 16 * np.sin(t)**3
y = 13 * np.cos(t) - 5 * np.cos(2*t) - 2 * np.cos(3*t) - np.cos(4*t)
# Create the plot
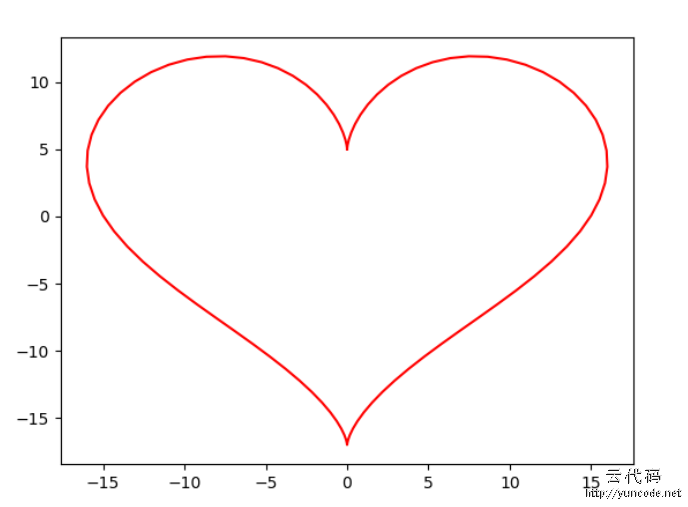
plt.plot(x, y, color='red')
plt.show()


高级设计师
by: Python自学 发表于:2022-12-10 15:56:40 顶(0) | 踩(0) 回复
回复评论